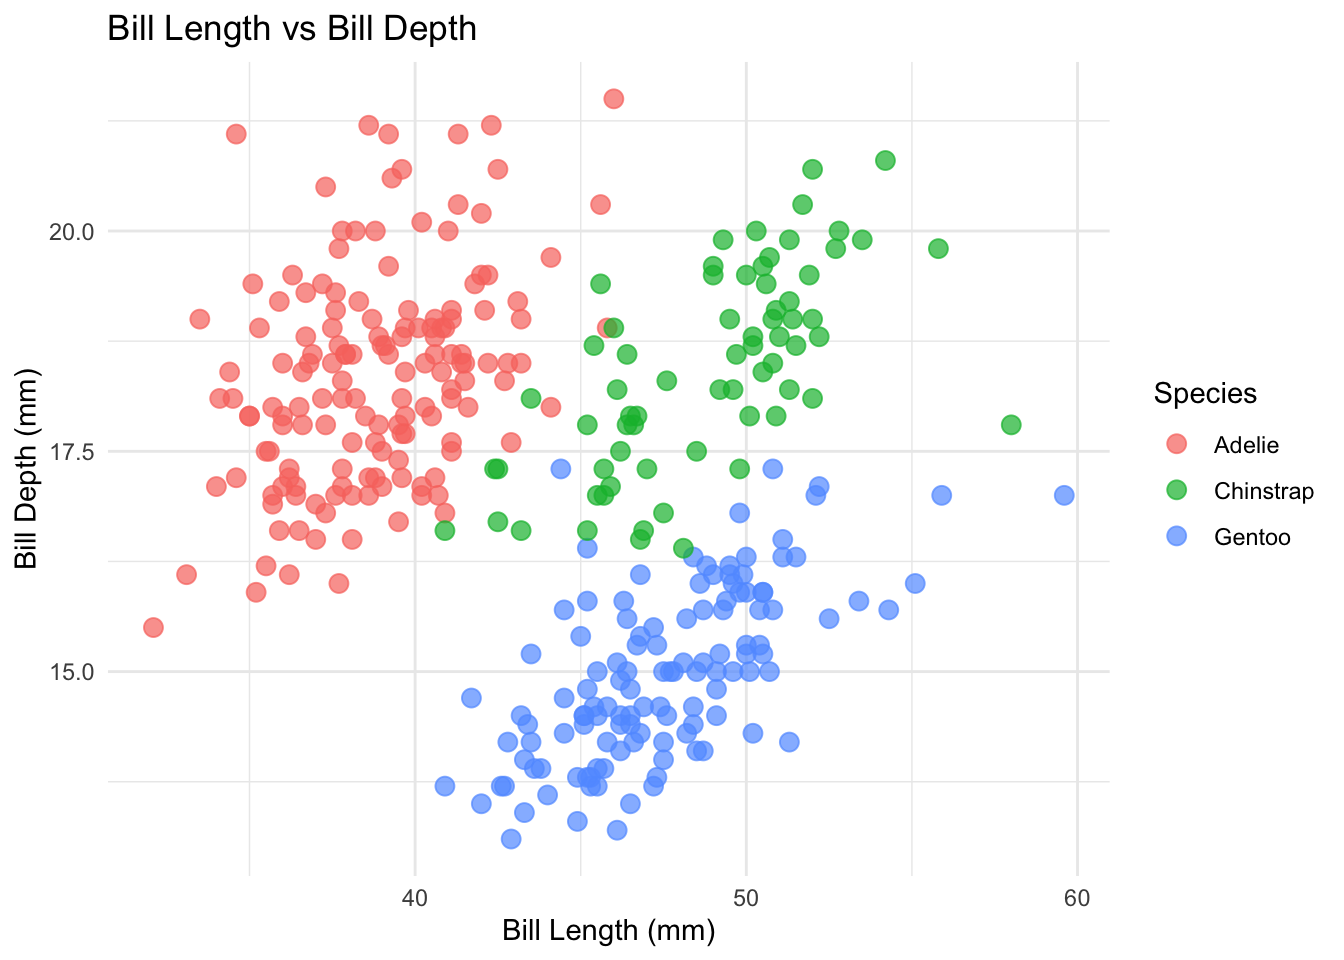
• Home
  • About
  • My Blog
  • Resume
  • Contact Info
    • LinkedIn
    • email
Categories
All (5)
Carbon accounting (1)
Climate (1)
Data Visualization (1)
GIS (1)
Geospatial (2)
Kriging (1)
Linear Regression (1)
MEDS (1)
Ocean Analysis (1)
Python (1)
R (3)
Raster data (1)
Shiny (1)
Vector data (1)
infographic (1)

My Blog

Streamlining Carbon Accounting for Darn Tough Vermont

R
Shiny
Carbon accounting

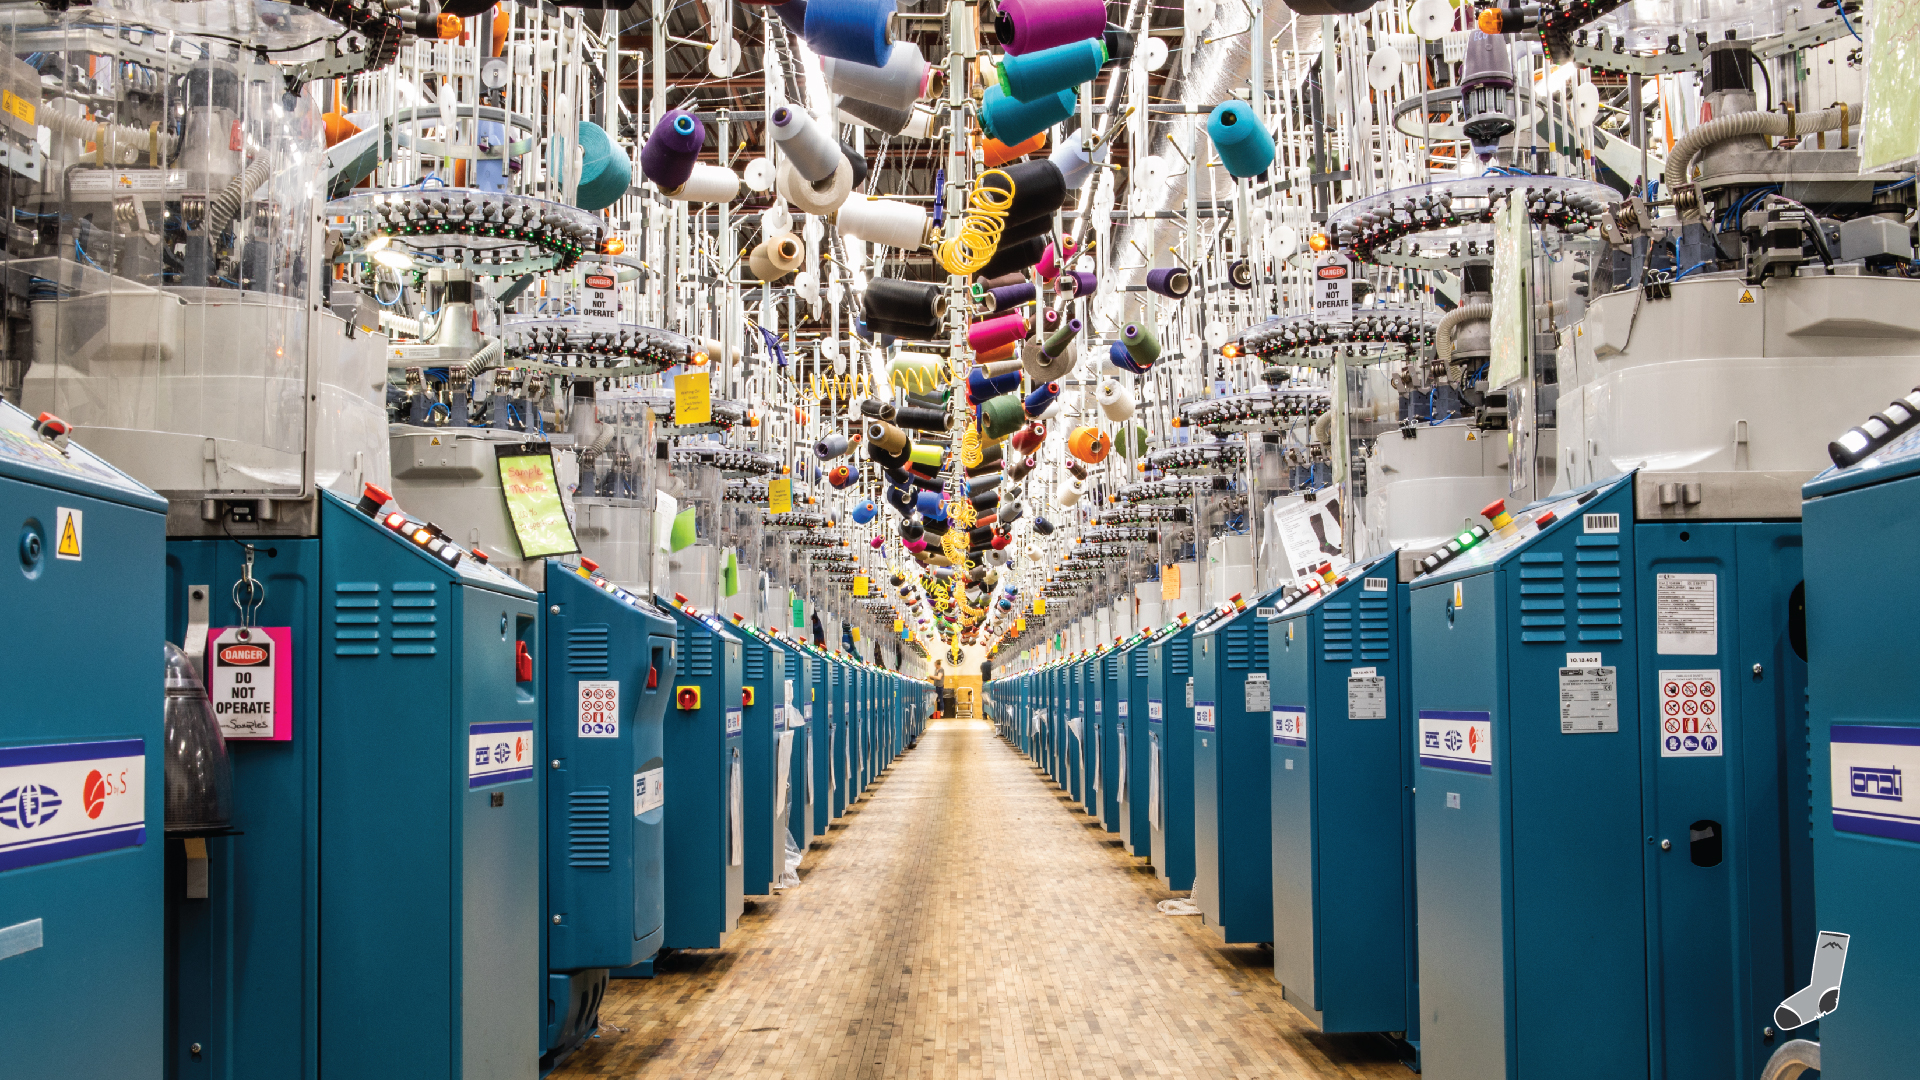
How we helped a sock manufacturer calculate their carbon emissions and pinpoint ways to meet reduction targets

Jun 18, 2024
Annie Adams, Carly Caswell, Flora Hamilton, Linus Ghanadan

Seattle Bike Trends

Data Visualization
R
infographic
As an avid bike rider and lover of alternative transit, I played around with some bike data from Seattle and created an infographic to showcase the trends that I found. I…
Mar 2, 2024
Annie Adams

Salinity in the CCE

Ocean Analysis
Geospatial
Linear Regression
Kriging

Exploring Salinity levels in the California Coastal Ecosystem

Dec 12, 2023
Annie Adams

Quantifying Houston Blackouts after Texas’ 2021 Winter Storm

Geospatial
R
Raster data
Vector data

Determining just how many houses in Houston, Texas lost power due to the 2021 storm

Dec 12, 2023
Annie Adams

Analyzing air quality after the Santa Barbara Thomas Fire

Python
GIS
Climate
MEDS

Implement both tabular and raster data to see changes in AQI before and after the Santa Barbara Thomas Fire in 2017.

Dec 6, 2023
Annie Adams
No matching items
Copyright 2023, Annie Adams